Blockchain Systems: Measuring Valuation, Spending Behaviour, and Adoption with Onchain Metrics
“Observe a system’s behaviour, and you can derive its purpose.”
— Donella Meadows
Systems and Purpose
If you observe the behaviour of a blockchain system, you will notice its core purpose is to facilitate the movement and storage of information and virtual assets within a peer-to-peer network. Aside from a purpose, all systems have interacting elements that generate data.
Systems and Data
In short, Blockchain is a system with interacting applications, virtual assets, and users responding to incentives. And like any interdependent system, it generates data. Consider Nike’s website. How users interact with the website (e.g., what users click on and where they spend their time) can generate data on their preferences. Similarly, how users interact with a blockchain system (e.g., how long users hold assets and what they’re used for) can generate data that tells us a story about human psychology and free-market behaviour on a blockchain network.
“You can’t improve what you don’t measure.” — Peter Drucker
Overview of Key Metrics
Blockchains enable direct access to data about free-market behaviour. But what can we measure? With Onchain metrics, we can measure adoption, spending behaviour, and valuation — allowing investors to improve their decision-making. Below is a summary of the measurements covered and the corresponding Onchain metrics.

Adoption
Users require virtual wallets to store, manage, and trade virtual assets on a blockchain network. Addresses, similar to a house address, connect the wallet to a location or user. These addresses enable virtual assets to be sent and received in a peer-to-peer network.
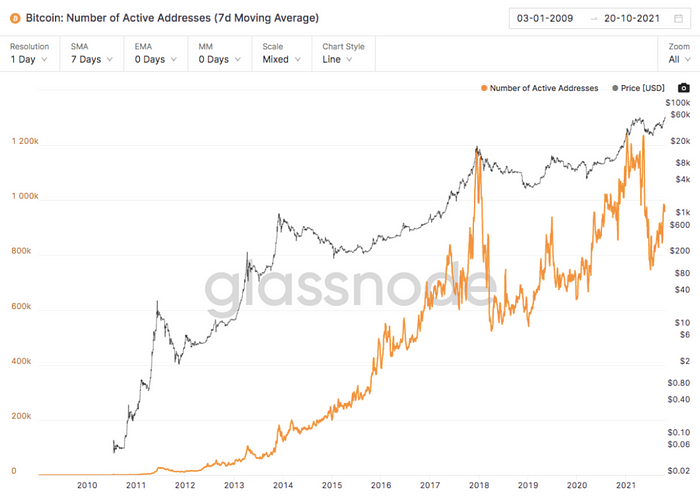
Using the active addresses metric, we can assess the unique number of participants exchanging value in a blockchain network. What constitutes an active address is one that successfully sends or receives a transaction. Given that facilitating transactions is a use case for a blockchain system, active addresses can measure changes in adoption. The figure below shows how price and active addresses generally move in the same direction — indicating that unique transactions and price are positively correlated.

Spending Behaviour
Users within a blockchain network have varying time preferences for holding value. Onchain metrics enable us to observe the tectonic forces that govern supply and demand between short-term and long-term holders. User’s spending behaviour can be measured using velocity and HODL waves metrics.
- Velocity measures how quickly units are circulating within a system. High values indicate that coins are “hot potatoes” and exchange hands quickly. High values can also indicate that coins are being used for short-term trading rather than long-term investing. In the figure below, Bitcoin’s velocity has remained relatively low — indicating that coins have remained in wallets for long periods before exchanging hands — an indicator of long-term confidence.

- HODL Waves measure the distribution of the overall supply between long-term and short-term holders. They can also be an indicator of long-term confidence or lack of confidence in a blockchain project. The width of the bands represents the distribution of total supply for holders of various time preferences. For example, in the graph below, observe how users holding coins for only 24 hours (dark red) represent a small portion of the overall supply. Warm and cool colours represent short and long-term time preferences, respectively. For example, red and orange shades represent shorter-term holders, while green, blue, and purple shades represent long-term holders.

The figure below shows how coins on the Bitcoin network that have remained in wallets for 2–10 years represent just under 50% of the total supply.

Valuation
The valuation of a blockchain network can be measured using the network value to transaction (NVT) metric. This metric assumes that the value of a blockchain is determined by the value of transaction throughput flowing through the network. In other words, the higher the aggregate transaction value flowing through a network, the higher the valuation. The chart below shows how Bitcoin’s total market cap is heavily correlated to the value of transaction throughput in the network.

The interpretation is similar to the P/E Ratio used in corporate finance. For example, high values can indicate overvalued blockchains with high growth expectations. It can also indicate that the value of transaction throughput does not justify the current valuation. In the chart below, observe how Bitcoin’s current NVT values are reaching relatively high levels.

Conclusions and Limitations
Blockchain has enabled new methods for analyzing economic activity. By leveraging on-chain metrics, we can measure valuation, spending behaviour, and adoption. However, given on-chain metrics is a young discipline, collective consensus about how metrics should be interpreted has yet to fully evolve.
References
Maddrey, Nate, and Kyle Waters. “The Rise of Nfts: A Data-Driven Overview of Non-Fungible Tokens.” Coin Metrics, 21 Sept. 2021, https://coinmetrics.io/the-rise-of-nfts/.
Txmc, and Glassnode. “Following the Smart Money: A Study of Long-Term Holders.” Glassnode Insights — On-Chain Market Intelligence, Glassnode , 11 Oct. 2021, https://insights.glassnode.com/follow-the-smart-money/.
Waters, Kyle, and Nate Maddrey . “Issue 122.” Coin Metrics’ State of the Network, Coin Metrics’ State of the Network, 28 Sept. 2021, https://coinmetrics.substack.com/p/coin-metrics-state-of-the-network-a0e.
“Why Look at on-Chain Data?” Glassnode Academy — Glassnode Academy, https://academy.glassnode.com/.
Woo, Willy. “Introducing NVT Ratio (Bitcoin’s PE Ratio), Use It to Detect Bubbles.” Woobull, Woobull, 3 Mar. 2019, https://woobull.com/introducing-nvt-ratio-bitcoins-pe-ratio-use-it-to-detect-bubbles/.
